xView Architecture⚓︎
xView collects metrics from every site in a deployment — xCore and xRouter alike — and stores them centrally, next to xControl, where alerts are evaluated and dashboards are drawn. This page explains how the metrics get there: what runs at a site, how a site's data reaches xControl without any inbound connection, and what xView does with it once it arrives.
xCore and xRouter are monitored by exactly the same mechanism: the same Expeto Agent relays what the site collector holds, so everything below applies to either; where this page says "a site", read "an xCore or xRouter site". The xRouter chart installs the site collector; on an xCore it is enabled at installation, as described in Verify the installation. xView additionally scrapes xControl directly, and the Kubernetes infrastructure of the cluster it runs in.
The one design constraint that shapes everything else is that a site is never connected to from outside. A site may sit behind a firewall the platform cannot reach through, so no site is polled. Instead each site pushes outward to xControl, and xView collects from xControl.
The path a metric takes⚓︎
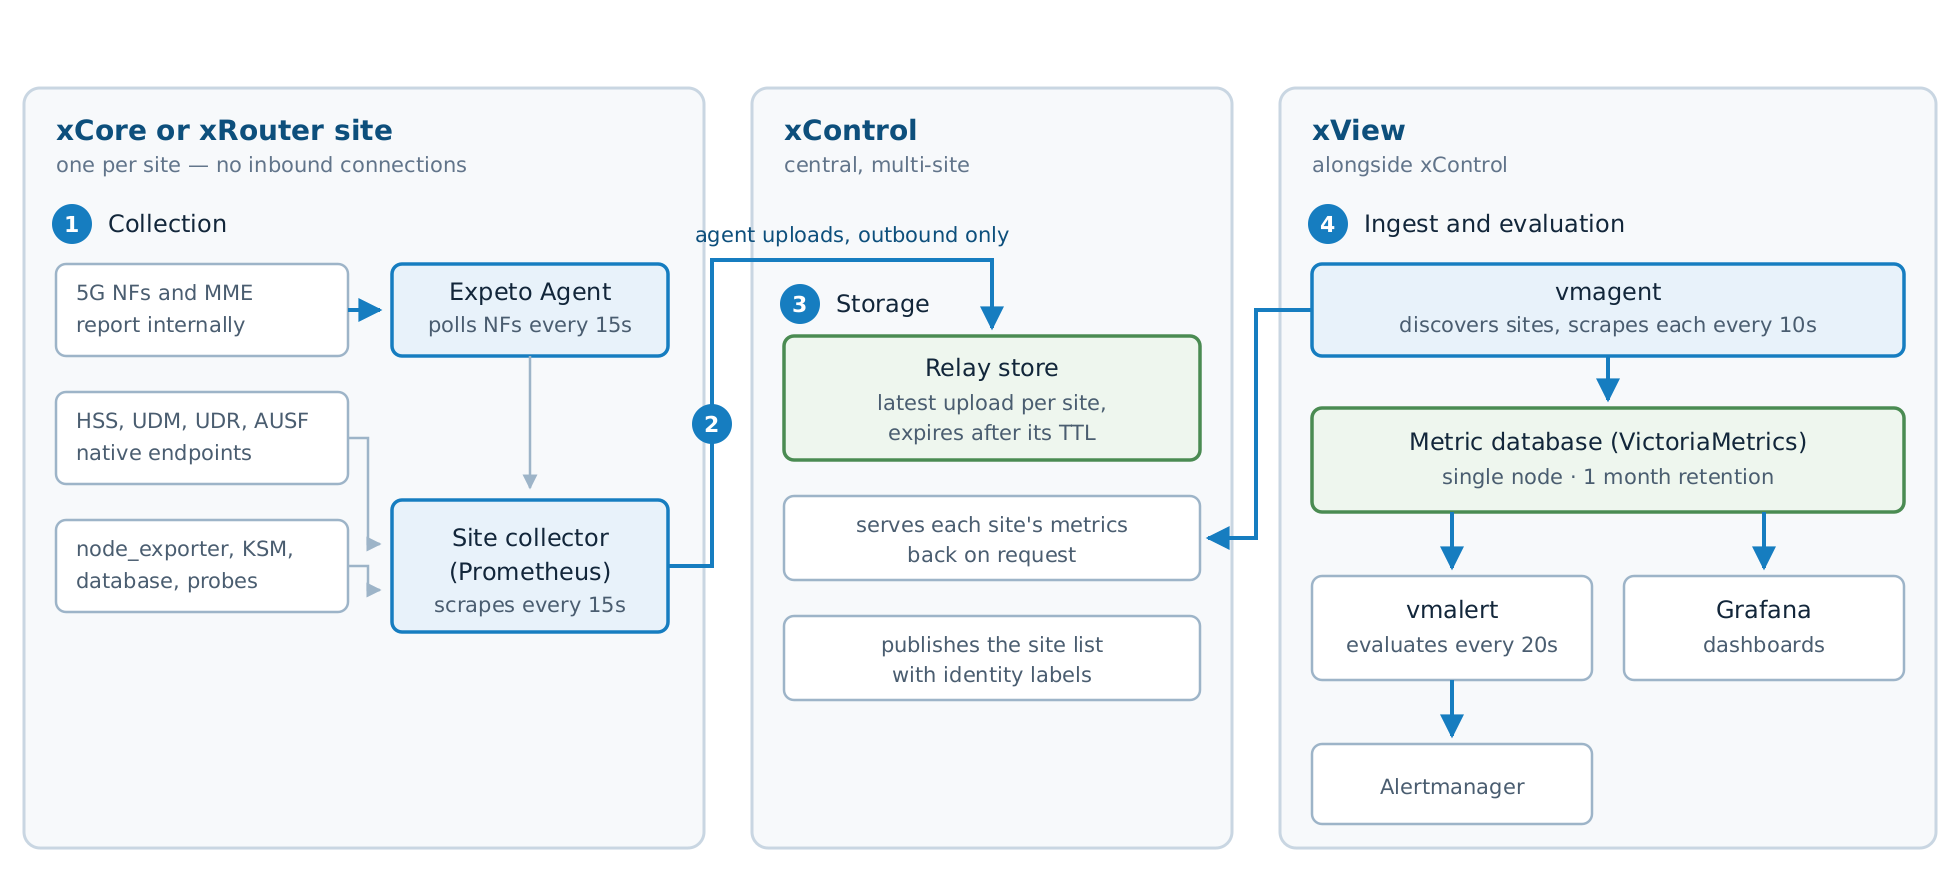
A single measurement — say a PFCP message counter in the SMF — travels four stages:
- Collection at the site. The measurement is exposed by an exporter and scraped by the site collector, a Prometheus instance running inside the site's cluster.
- Relay to xControl. The Expeto Agent reads the collector's accumulated metrics and uploads them to xControl over the same outbound connection it already uses for configuration.
- Storage at xControl. xControl keeps the most recent upload from each site and serves it back on request.
- Ingest at xView. xView discovers the sites from xControl and scrapes each one's metrics through xControl, writing them into its own database, where alerts and dashboards read them.
Stage 1 — collection at the site⚓︎
Not every network function exposes metrics the same way, and this is the part that surprises people most often. There are three routes, described in full in Data Sources and Exporters:
- The Expeto Agent acts as the exporter for the 5G network functions and the MME. Those
functions do not serve a metrics endpoint of their own; they report counters internally, and the
agent polls them every 15 seconds and republishes everything as Prometheus metrics on its own
endpoint. Most
xcore_*metrics you will ever query arrive this way. - Some functions expose Prometheus natively — HSS, UDM, UDR and AUSF each serve their own metrics endpoint, which the collector scrapes directly.
- Third-party exporters cover everything that is not an Expeto component: hosts, Kubernetes objects, the site database, and synthetic probes.
The site collector scrapes all of these every 15 seconds and keeps roughly three days of history in no more than 10 GB. That local history is a buffer, not an archive — it exists so a temporary loss of connectivity to xControl does not lose data outright.
Stage 2 — relay to xControl⚓︎
The Expeto Agent runs a metric upload loop. For each monitoring endpoint configured for the site, it fetches that endpoint's URL and posts the response to xControl:
- It requests compressed data and relays the compressed bytes without decompressing them, so a site's upload stays small over what is often a constrained link.
- It posts to xControl with a time-to-live equal to the endpoint's scrape interval, so xControl knows exactly how long the data it is holding should be considered current.
- Fetches use short timeouts — a few seconds — so a wedged endpoint delays one upload rather than stalling the loop.
In a standard deployment the endpoint the agent fetches is the site collector's federation endpoint, which returns every series the collector holds in one response. This is why the whole of a site's monitoring arrives at xControl as a single upload, rather than xView having to know about each exporter at each site.
Monitoring endpoints are configuration, not code: they are records in xControl, one per site, each with a URL, a scrape interval and a job name. Adding a new source of metrics at a site is an xControl change, described in Data Sources and Exporters.
Stage 3 — storage at xControl⚓︎
xControl stores the most recent upload per site and serves it back on demand. Two details matter operationally:
- It is a cache, not a proxy. When xView asks xControl for a site's metrics, xControl answers from the stored copy. It does not reach out to the site. A site that is unreachable therefore cannot slow down or block the central scrape.
- Stored data expires. Each upload carries a time-to-live. Once it lapses without a fresh upload, the request for that site's metrics fails rather than returning stale numbers.
xControl also publishes the list of sites to monitor, with each site's identity labels attached. That list is what xView uses to discover what to scrape.
Stage 4 — ingest at xView⚓︎
xView's collection agent, vmagent, asks xControl for the site list every few seconds and scrapes each site's stored metrics through xControl. Every scrape is honored-labels, meaning the identity labels already present in a site's data take precedence over anything the scrape would add — see Metric Labels and Conventions.
Because a whole site arrives in one response, these scrapes are far larger than a normal Prometheus scrape, and xView raises its maximum scrape size well above the default to accommodate them. An undersized limit shows up as a site whose metrics stop arriving while the site itself is healthy.
From there:
- Samples are written to the metric database, a single-node VictoriaMetrics instance.
- The rule evaluator reads the database every 20 seconds, evaluates every alert rule, and sends anything firing to Alertmanager.
- Grafana queries the same database for dashboards.
Freshness: how old is the data you are looking at?⚓︎
Each stage adds delay, and they add up:
| Stage | Typical delay |
|---|---|
| Network function to the agent | up to 15s |
| Agent to the site collector | up to 15s |
| Collector to xControl, via the agent's upload | one scrape interval |
| xControl to xView | up to 10s |
| Rule evaluation | up to 20s |
In practice a change at a site is visible centrally within about a minute, and an alert on it fires
within the alert's own for duration on top of that. When a site is first brought up, allow several
minutes before concluding that its metrics are missing — the discovery, scrape and reload steps all
have to complete before the first sample lands.
Note
This is a pull pipeline with a store-and-forward stage in the middle, so it is normal for central data to lag a site by tens of seconds. Do not use xView timestamps to reason about the ordering of events inside a site; use the site's own logs for that.
What happens when a site goes offline⚓︎
The failure path is worth knowing because it explains the alert you will actually see:
- The site stops uploading, because the agent cannot reach xControl.
- The stored copy at xControl reaches its time-to-live and expires.
- xView's next scrape for that site fails, and the
upmetric for it goes to zero. - xCoreAgentOutOfContact fires, escalating to its Tier2 and Tier3 variants if the condition persists.
Metrics collected at the site during the outage are not backfilled when it recovers; the site's local collector holds them, but only the most recent upload is ever transferred. Expect a gap in central data for the duration of the outage.
To suppress alerts for planned work, mark the site's state rather than silencing individual alerts — see suspending monitoring.
What xView is made of⚓︎
xView is a Helm chart. It has no application code of its own: it deploys, configures and integrates well-established open-source components, and adds Expeto's alert rules, dashboards and scrape configuration on top.
| Component | Role | Upstream |
|---|---|---|
| VictoriaMetrics (single-node) | The metric database | docs.victoriametrics.com |
| vmagent | Scrapes targets and writes to the database | vmagent |
| vmalert | Evaluates alert and recording rules | vmalert |
| Alertmanager | Routes, groups and delivers firing alerts | Alertmanager |
| VictoriaMetrics Operator | Manages the above as Kubernetes resources | operator |
| Grafana, via Grafana Operator | Dashboards and visual exploration | Grafana, operator |
| kube-state-metrics | Kubernetes object state | kube-state-metrics |
| node_exporter | Host-level metrics | node_exporter |
Two consequences of this design are worth stating plainly:
- Anything you know about Prometheus applies. VictoriaMetrics speaks PromQL, the alert rules are
ordinary Prometheus rules, and Prometheus-format exporters work unchanged. Rules written as
Kubernetes
PrometheusRuleobjects are converted automatically — see Custom Alerts and Rules. - The database is single-node. It is not a clustered or replicated store. Size and protect its storage accordingly, and treat long-term retention of metrics as a separate concern from the operational window xView keeps.
Storage and retention⚓︎
| Default | |
|---|---|
| Retention | 1 month |
| Database storage | 20 GiB |
| Database replicas | 1 |
| Site collector retention | 3 days, capped at 10 GB |
Retention is a deployment-time setting. Raising it raises the storage requirement roughly in proportion, and the number of sites is the dominant factor in how fast that storage fills, since every site contributes its full metric set.
Where to go next⚓︎
- Data Sources and Exporters — every exporter, what it covers, and how to add one
- Metric Labels and Conventions — the labels attached along this path
- Monitored Endpoints — every scrape job in a standard deployment
- Accessing xView — dashboards, queries and alert delivery