xView Guide⚓︎
Introduction⚓︎
xView is a network monitoring system (NMS) based on the open source Prometheus platform, providing metrics collection and alert triggering capabilities. Its distributed architecture offers comprehensive network monitoring with a centralized aggregated view of the Expeto Platform operational status.
The NMS collector agents gather metrics from all platform components, federate these metrics, and forward them to the NMS master. The master evaluates the metrics against alert expressions stored in the Expeto alert library, triggering alerts when expressions remain unresolved. xView integrates with third-party tools such as Grafana and Datadog for data visualization and NetCool for alert management.
Key features:⚓︎
- Distributed and configurable architecture
- Dynamic service discovery of endpoints to monitor
- Centralized aggregated view
- Integration with third-party systems
How xView Works⚓︎
Monitored endpoints are created on deployments by Expeto at strategic component locations.
At regular polling times, NMS-collectors scrape metrics from the monitored endpoints. The metrics are federated across NMS-collectors and sent to the NMS-Master where they are used to evaluate alert expressions stored in the Expeto Alert Library.
If an alert expression evaluates to true, an alert is created with a status of pending. The pending state prevents the creation of multiple alert instances for the same incident (alert flapping). If the alert remains true for the time interval defined in the alert expression, the alert status changes to fired. The alert clears when the polled metrics cause the alert expression to evaluate to false.
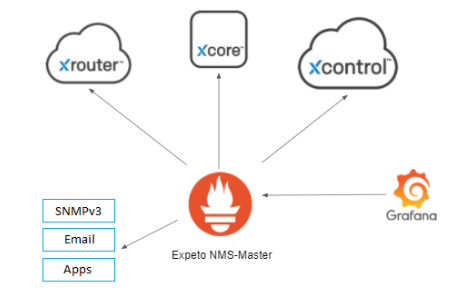
xView integrates with third-party alert monitoring and management tools. In the xView Architecture example below:
- Metrics from the Expeto platform components are collected by Prometheus using native and third-party exporters.
- Grafana fetches only the metrics needed to populate its custom dashboard configuration.
- Alerts can be sent to a third-party tool to kick off a ticket flow.
Metric Exporters⚓︎
Metric exporters collect and send metrics from the Expeto platform components to the Prometheus master. Each exporter focuses on specific categories of metrics. They are configured as
| Exporter Name | Prometheus Job Name | Notes |
|---|---|---|
| Node Exporter | job="node" |
Provides VM node metrics and server health. |
| Docker Exporter | job="docker" |
Collects metrics about Docker containers. |
| Prometheus | job="prometheus" |
Collects metrics about Prometheus exporters. |
| xAgent Exporter | job="xAgent" |
Provides metrics about the xCore host site. |
| Secure Gateway | job="SecGw" |
|
| Alert Manager | job="alertManager" |
|
| AUSF Exporter | job="ausf" |
|
| Exporter | job="blackbox-q-ls" |
|
| Exporter | job="broker" |
|
| Exporter | job="grafana" |
|
| HSS Exporter | job="hss" |
|
| Kubernetes Exporter | job="k8s" |
|
| Kublet Exporter | job="kubelet" |
|
| Exporter | job="local_config_file" |
|
| MariaDB Exporter | job="mariadb" |
|
| MariaDB Galera Exporter | job="mariadb-galera" |
|
| PostgresSQL Exporter | job="postgres" |
|
| xCore Exporter | job="site" |
|
| UDM Exporter | job="udm" |
|
| UDR Exporter | job="udr" |
|
| xControl Exporter | job="xControl" |
|
| Rec Exporter | job="x_rec" |
Enable or Suspend Monitoring⚓︎
Suspending monitoring is recommended to avoid a flood of unnecessary alerts when taking a Site down for maintenance.
To suspend monitoring at the Site level:
- Open xControl, navigate to Sites, and click the name of the Site you want to exclude from monitoring.
- Click Edit.
- Create or edit the following Extension: label.site_state.
- Assign one of the following values:
- maintenance
- decommissioned
- Click Save.
The extension appears listed with other key parameters for the Site.
To enable monitoring for the Site, either delete the extension or set it to enabled.
Anatomy of an Alert⚓︎
All Expeto alerts are metrics-based and defined in the alerts.rules file in YAML format located in /etc/prometheus on the Prometheus server. The actual triggering (firing) of the alert occurs only after the metrics-based expression in the alert definition evaluates to true and remains true over a period of time.
The metrics-based expression is written in PromQL (Prometheus Query Language) in the expr alert parameter.
The time period is defined in the for alert parameter.
For example, the following ExpetoContainerDown alert checks whether any container starting with the name “expeto” is equal to 0 (indicating the container is down). If any Expeto container remains down for 2 minutes, the alert is fired.
name: ExpetoContainerDown
expr: docker_container_running_state{name=~"expeto.*"} == 0
for: 2m
Some alerts contain additional tiers (Tier2, Tier3), firing an additional alert after more time has elapsed and indicating that conditions causing the initial alert still exist.
For example, the xCoreAgentOutOfContact alert initially fires after being evaluated as true for 5 minutes. The tier2 version of the alert fires after being true for 1 hour. The tier3 version of the alert fires after being true for 4 hours.
name: xCoreAgentOutOfContact
expr: up{job="site",site_state!~"decommissioned|maintenance|poc",tier=~"1|"} == 0
for: 5m
name: xCoreAgentOutOfContactTier2
expr: up{job="site",site_state!~"decommissioned|maintenance|poc",tier="2"} == 0
for: 1h
name: xCoreAgentOutOfContactTier3
expr: up{job="site",site_state!~"decommissioned|maintenance|poc",tier="3"} == 0
for: 4h
Labels attached to the alert provide troubleshooting information, such as customer, site, monitoring endpoint instance, and monitoring job name. Use labels for search queries in Prometheus or NetCool to find all alerts belonging to a specific site or customer.
Alert Parameters⚓︎
Each alert contains the following parameters:
- Name: The name of the alert.
-
Expr: The Prometheus alert expression that includes the metric variables for evaluation. If the expression evaluates as true, the alert is activated. If the alert has a for time greater than 0, the alert is pending until the for time interval elapses, at which point the alert is fired. Note that some alerts contain additional conditions that prevent the alert expression from evaluating as true.
For example, the Node Down alert contains the following alert expression that filters out Sites set to decommissioned or maintenance:
up{job="node",site_state!~"decommissioned|maintenance"} == 0 -
For: The amount of time the alert must remain evaluated as true before the alert is actually fired. This prevents alert flapping. The for value can be expressed in seconds, minutes, hours, or days. The following PrometheusCollectorDown alert rests in a pending state for 3 minutes before firing:
name: PrometheusCollectorDown
expr: up{job="prometheus",site_state!~"decommissioned|maintenance"} == 0
for: 3m
An alert with a for value of 0 (or no for value), is fired immediately. There is no pending state.
-
Labels: Metadata for the alert. Currently used to set the severity level of the alert. Other labels are used in the annotations section. See Labels section for more information.
-
Annotations: A section that includes the debug, description, and summary information.
-
Debug: Lists all labels attached to the alert. Useful for filtering queries and troubleshooting.
debug: {{ $labels }} -
Description: A verbose alert message using label values to describe the details of the alert. Includes expanded endpoint URIs that provide links to resources in xControl.
Disk space usage is at 93 percent on device /mnt on VmName001 at SiteName001 (https://myCompany.com/v1/sites/27351) for Customer001 (https://myCompany.com/v1/customers/1851). -
Summary: An alert message using label values to provide enough information about the alert to start troubleshooting.
High disk space usage on VmName001 at SiteName001 for Customer001.
Labels⚓︎
Labels are key-value pairs that are used in the alert annotations and can also be used as filters in search queries on third-party alert management tools or ticket systems. For example, you could find all alerts for a given site or customer.
Many labels, such as siteId or customerId, are automatically generated by xControl. Others are set by Prometheus, such as xName, which provides the name of the Prometheus job that scraped the metrics. Additional custom labels can be manually set as extensions at the site or at the monitoring endpoint.
Use of Labels in Alert Annotations⚓︎
The annotations section uses labels as variables to generate the alert messages.
annotations:

summary: "The network interface down {{ if $labels.vmName }}on {{ $labels.vmName }} {{ end }}{{ if $labels.site }}at {{ $labels.site }} for {{ $labels.customer }}{{ end }}"

description: "The network interface {{ $labels.device }} is down {{ if $labels.vmName }}on {{ $labels.vmName }} {{ end }}{{ if $labels.site }}at {{ $labels.site }}({{ $labels.siteId }}) for {{ $labels.customer }}({{ $labels.customerId}}){{ end }}"

debug: "{{ $labels }}"
The resulting alert messages look like this:
summary: The network interface down on VmName001 at SiteName001 for Customer001

description: The docker container expeto-hss is down on VmName001 at SiteName001 (...) for Customer001 (...)
Site State Labels⚓︎
Another important use of labels is to tag a site as being under maintenance or out of commission. When a site is tagged, no alerts are generated for that site. This is achieved with the following extensions at the site level:
- label.site_state = maintenance
- label.site_state = decommissioned
For more details, refer to the Enable or Suspend Monitoring section.
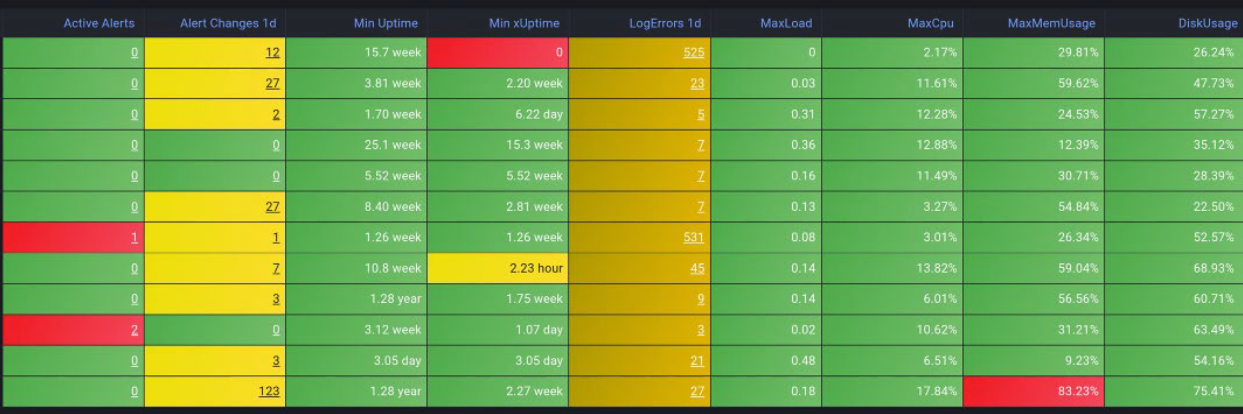
Metrics Visualization⚓︎
The collected metrics are available for display and evaluation in data visualization applications such as Splunk, Datadog, or Grafana regardless of whether conditions to trigger an alert are met.
The following screenshots show integration with Grafana.
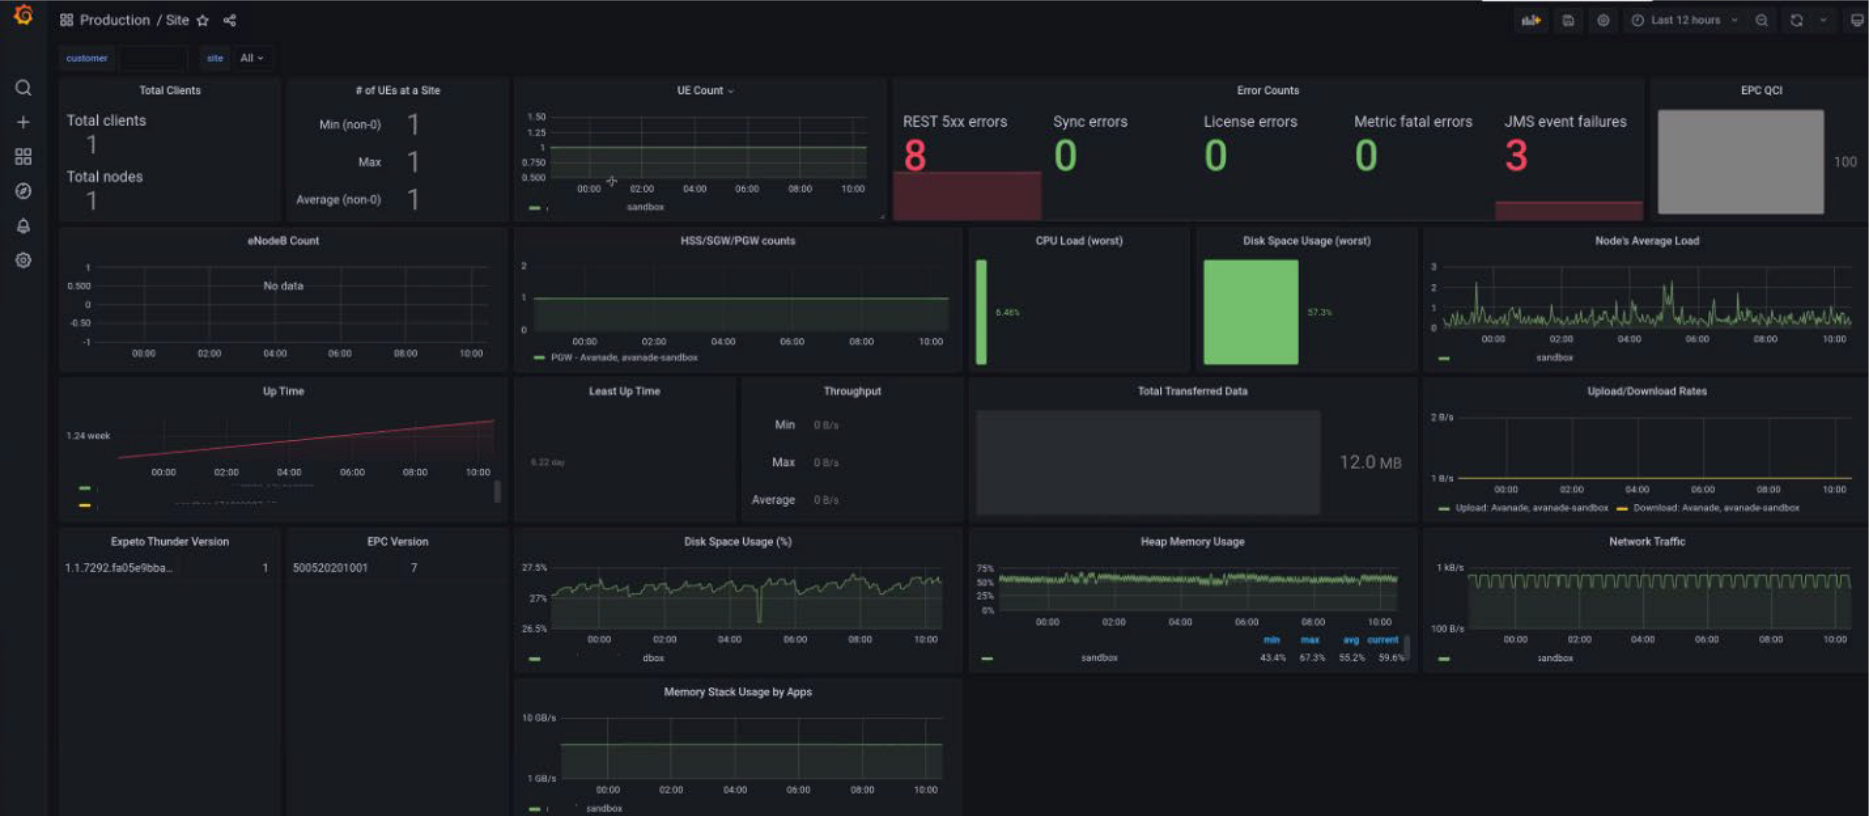
Only the metrics required to populate the configured dashboard are fetched.