Dashboard⚓︎
Overview⚓︎
The dashboard provides administrators with real-time visual monitoring of key network components, including Subscribers, Sites, and Systems. It offers both static and interactive panels for quick insights into the network's status and trends. Context-specific panels are available on related pages, such as Customers, Sites, Systems, and Subscribers, enabling more targeted analysis.
Key features include:
- Overview Metrics: Displays counts and 30-day trends for Mobile Assets, Sites, and Systems, helping administrators identify issues and monitor performance changes.
- Network Topology: An interactive map of Customers, Sites, and Systems, showing their relationships for easier navigation and analysis.
- Geographical Map: Provides a location-based view of Mobile Assets, Sites, and Private Radios, with filtering options for access type and status.
- Data Usage History: Graphs displaying network data usage over time, configurable by date range and grouping criteria for deeper insights.
The dashboard integrates seamlessly with xControl and supports advanced monitoring through third-party tools like Datadog.
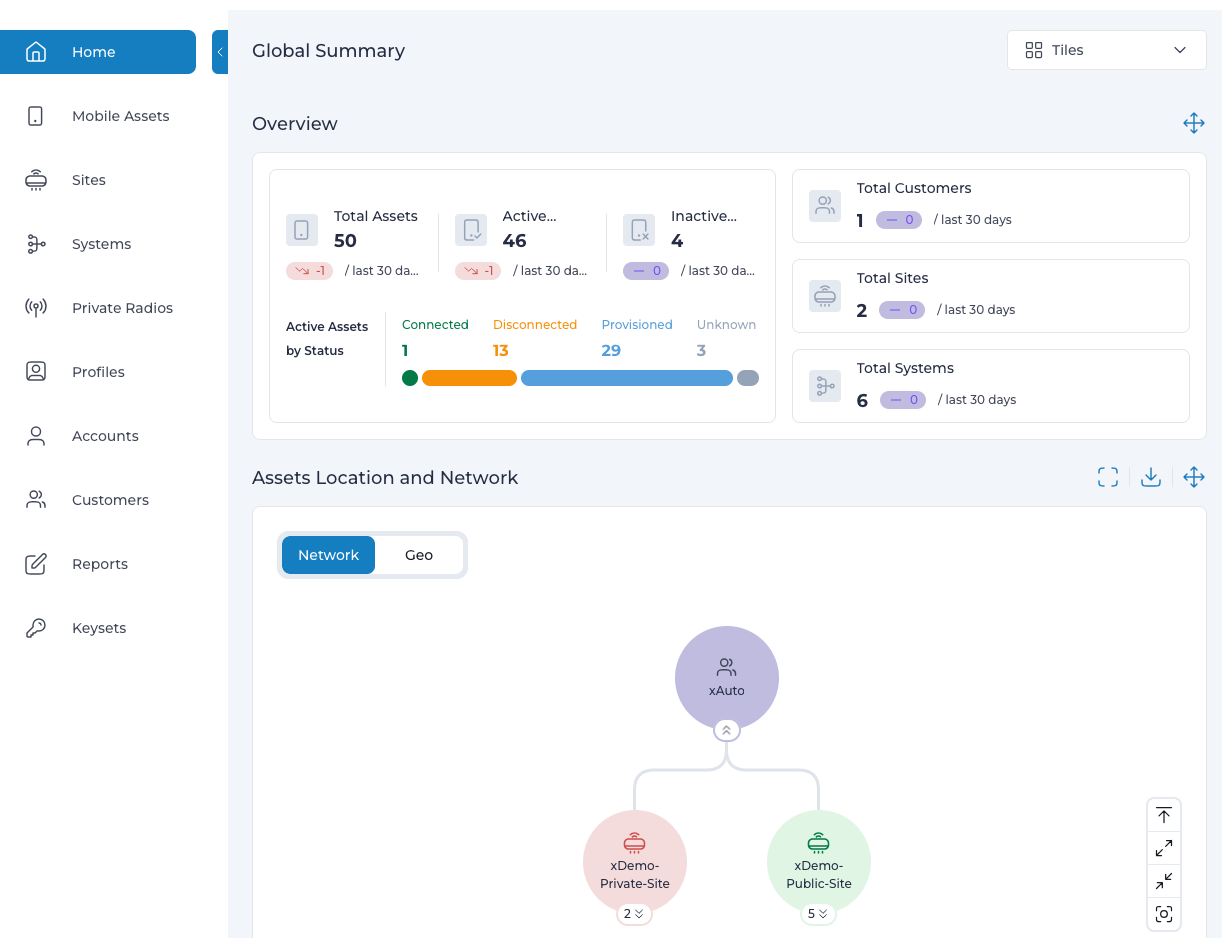
Click a panel to navigate to the corresponding component page to see more information.
Network Topology⚓︎
Interactive network topology view of Customers, Sites and Systems and their relations.
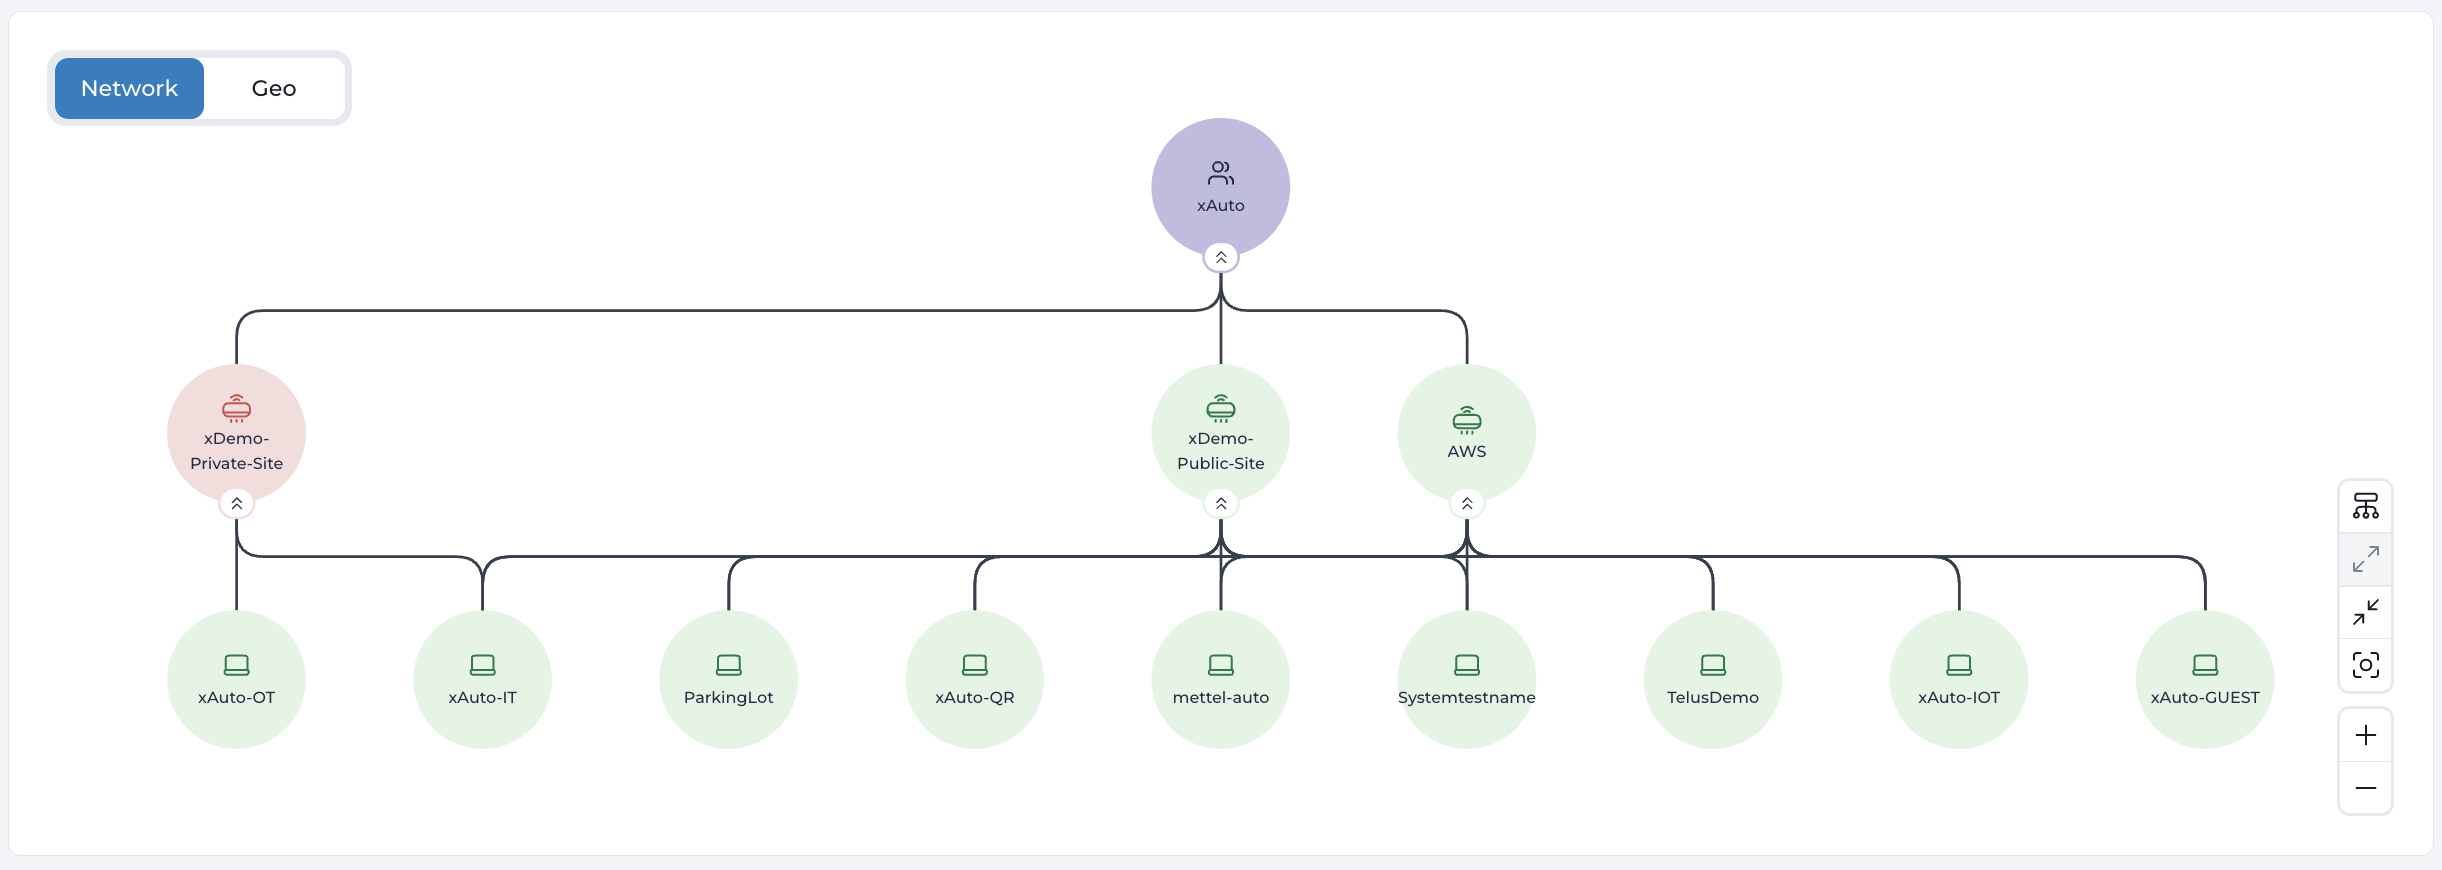
Hover your mouse over the nodes bars to view details and navigate to the entity.
Geographical Map⚓︎
Geographical map displays locations of Mobile Assets, Sites and Private Radios.
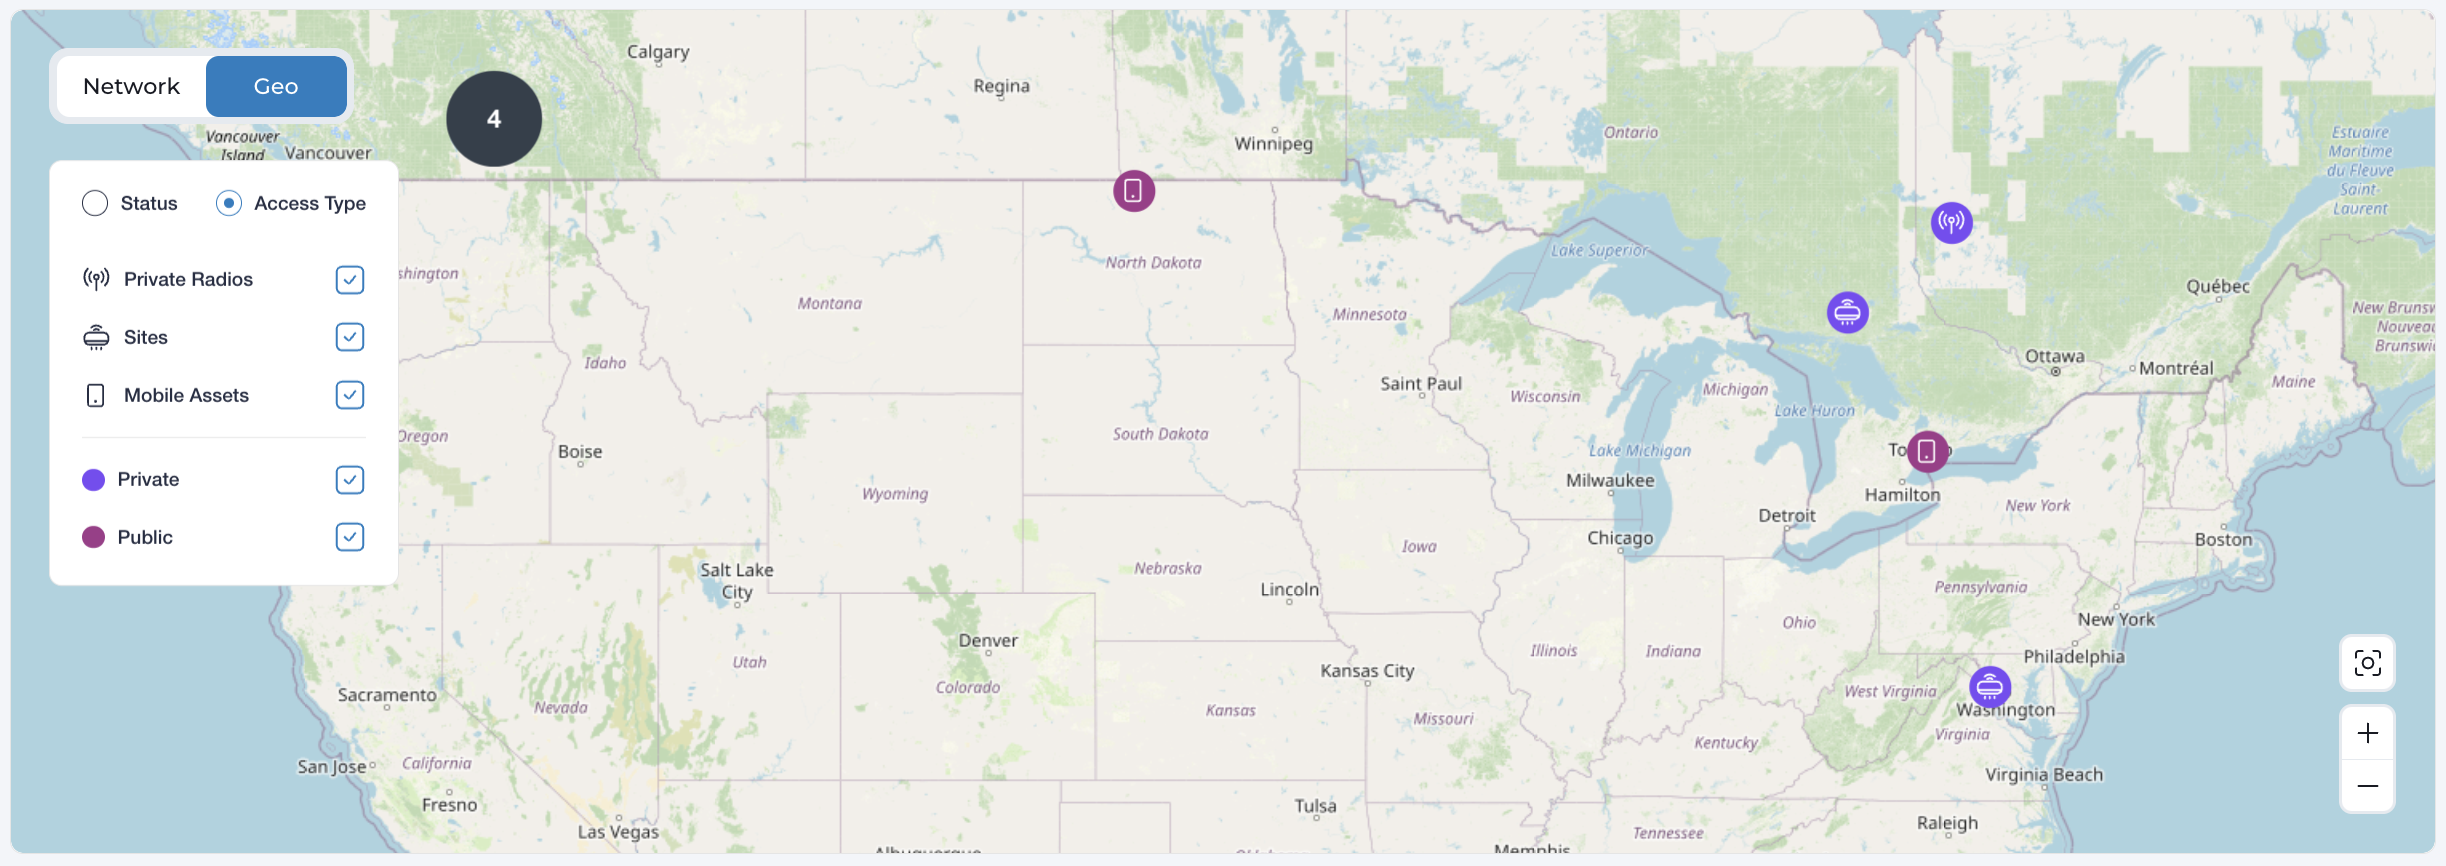
Hover your mouse over the map items to view details.
Select Status or Access Type to view Mobile Assets, Sites and Private Radios by their Access Type (Private or Public). Then select filter by specific Access Type or Status.
Click on the Fit button anytime to recenter the map to fit all the items in the view.
Data Usage⚓︎
Data Usage panel panels contain graphs displaying network data usage history based on configurable criteria.
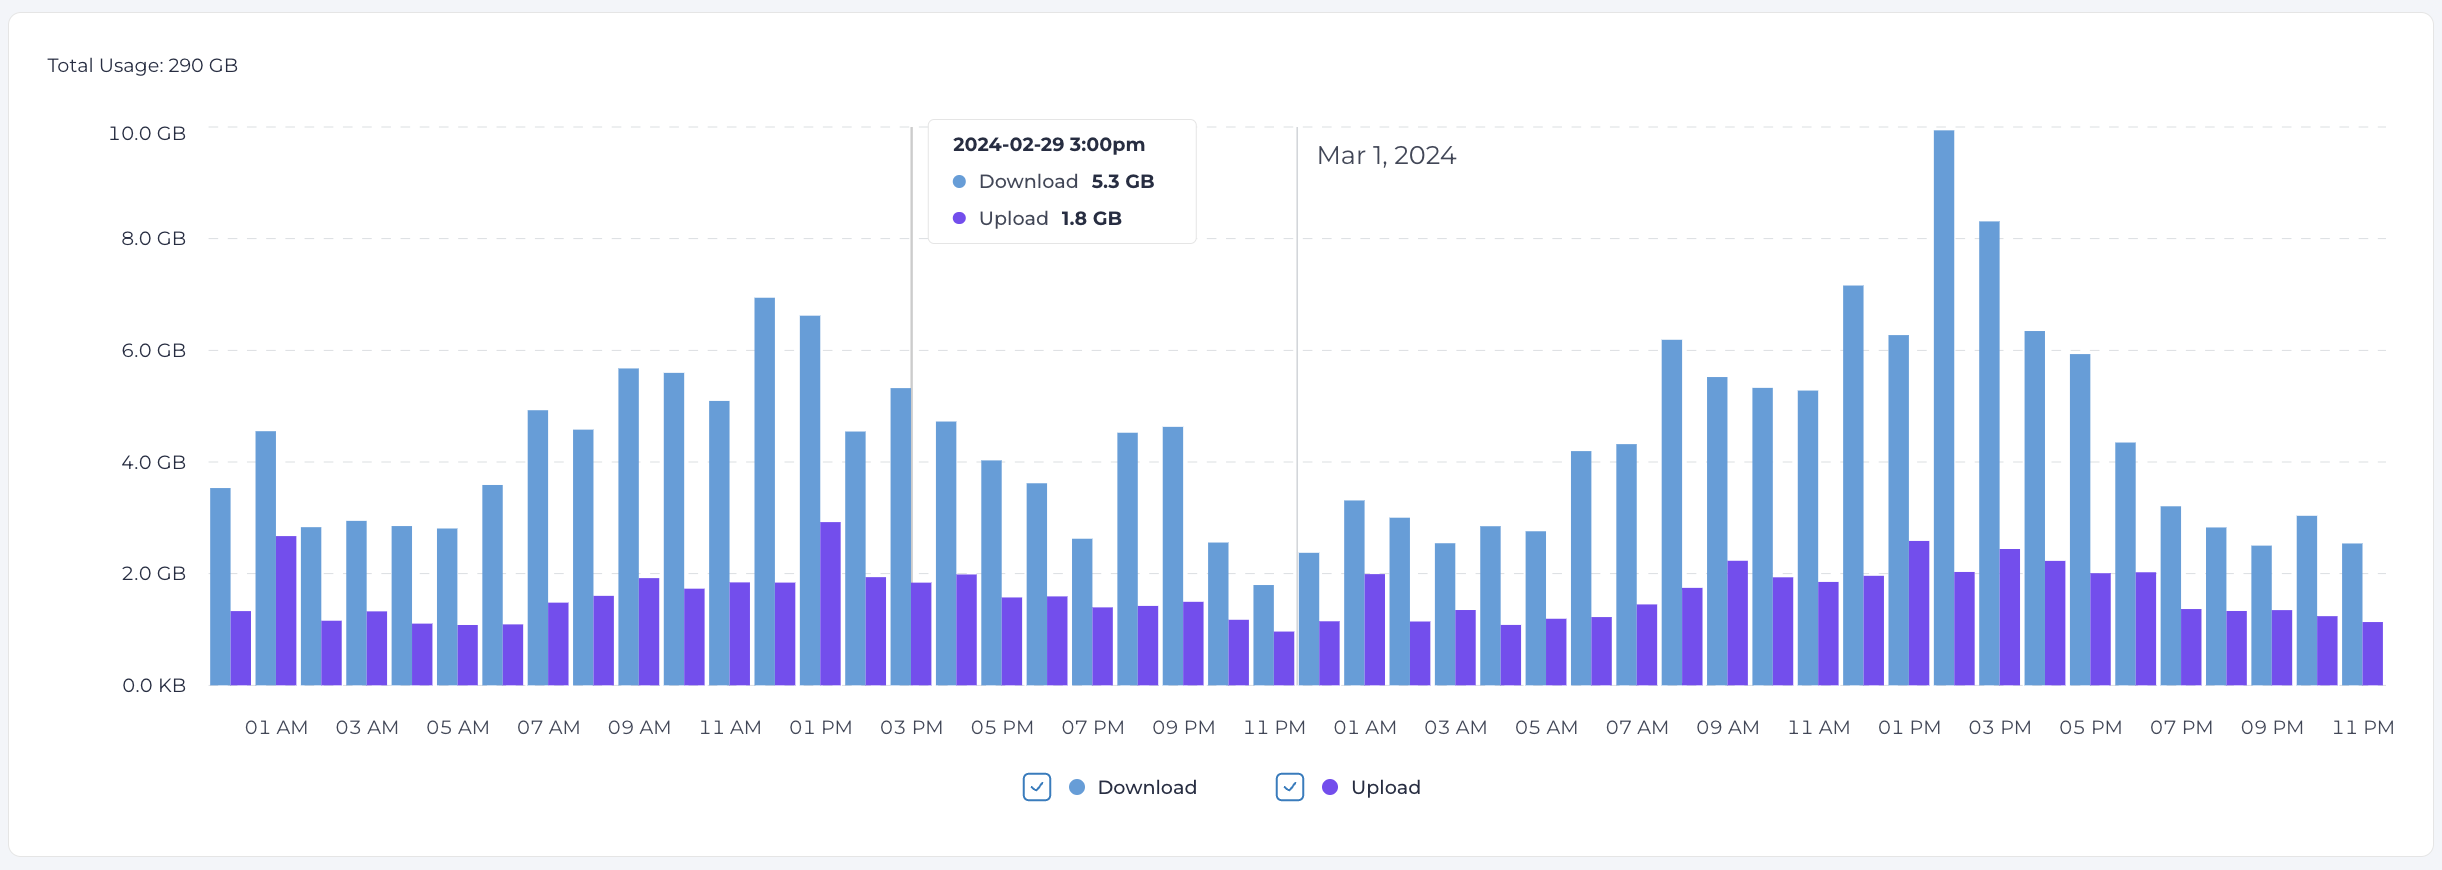
Hover your mouse over the graph\'s vertical bars to view finer statistical details.
!!! note Data usage graphs are also available in Mobile Assets, Sites, Systems, Customers pages and in their details pages.
Grouping⚓︎
Customize the graph by selecting the Group By: Total, AccessType, or Direction. This increases granularity by providing a comparative view of how much bandwidth, for example, each Subscriber or System has used.
Grouping by Direction displays the usage data broken into download and upload metrics.
Setting Date Range⚓︎
Select one of the Period options from the dropdown menu, or click the existing range to access the calendar, then manually choose a start and end date.